
TL;DR
This comparative analysis examines ServiceNow, Microsoft, Adobe, Workday, and Atlassian, dissecting their valuation, growth, and technical signals amidst broader software sector dynamics. It highlights key differentiators and potential tactical opportunities for investors.
Software Sector Dynamics: A Comparative Analysis
The Question: Will software companies be replaced by AI agents or will they be a refuge in times of upheavals?
Quick Summary: This analysis provides a head-to-head comparison of ServiceNow, Inc. (NOW), Microsoft Corporation (MSFT), Adobe Inc. (ADBE), Workday, Inc. (WDAY), and Atlassian Corporation (TEAM). The focus is on their current market positions, evaluating valuation, growth, and technical signals.
The software sector, a cornerstone of the modern economy, is currently grappling with fundamental questions regarding the impact of artificial intelligence and broader market upheavals. This analysis evaluates five prominent technology companies—ServiceNow, Inc. (NOW), Microsoft Corporation (MSFT), Adobe Inc. (ADBE), Workday, Inc. (WDAY), and Atlassian Corporation (TEAM)—through the lens of valuation metrics, growth prospects, and technical trading signals. Latest prices (USD) are: ServiceNow $90.46, Microsoft $392.66, Adobe $241.21, Workday $119.47, and Atlassian $61.79. EU-based readers should treat figures as USD unless stated otherwise. The objective is to provide investors with insight into their current market positions and potential future trajectories. The assessment criteria encompass Price-to-Earnings (P/E) and Price-to-Book (P/B) ratios, market capitalization, Earnings Per Share (EPS), Return on Equity (ROE), Return on Assets (ROA), as well as momentum indicators like the Relative Strength Index (RSI), moving averages, support and resistance levels, and composite model scores.
ServiceNow, Inc. (NOW)
ServiceNow, Inc. trades at a P/E ratio of 66.04, placing it at the higher end of the valuation spectrum among its peers, with a market capitalization of $117.07 billion. The latest price at $90.46 reflects a significant decline from its 52-week high of $208.94. The company reported an EPS (TTM) of $1.69, alongside profitability metrics showing an ROE of 13.48% and an ROA of 6.71%.
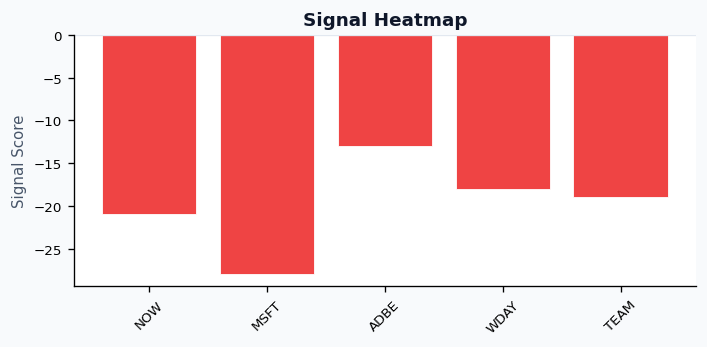
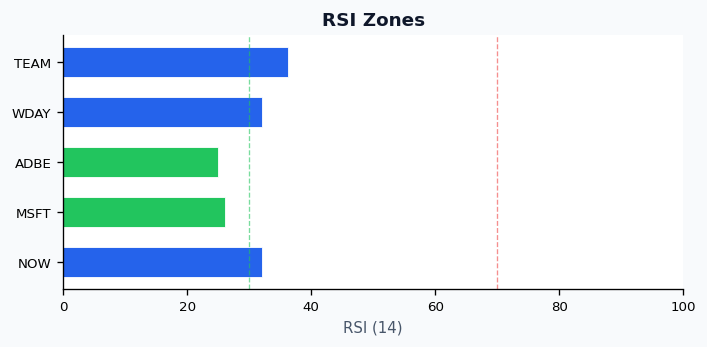
Technically, ServiceNow is in a bearish trend, with its price below both the 50-day Simple Moving Average (SMA) at $112.85 and the 200-day SMA at $162.03. Momentum indicators suggest a potentially oversold condition, with the 14-period RSI at a neutral 32.13. The composite model score is -21, categorized as mildly bearish with medium confidence. Key technical levels include support near $97.61 and resistance near $101.94; the latest MCP print sits below that support zone, so that area may behave as overhead until reclaimed. A strong bullish divergence on the RSI suggests the potential for a reversal, although identified candlestick patterns include both bearish (CDLMARUBOZU) and bullish (CDLHARAMI) formations, indicating mixed short-term signals.
Fundamentally, ServiceNow has historically been a favored stock, recognized for its resilience within the software sector. Recent reports suggest the company is considered an integral component of the broader AI infrastructure buildout, providing a fundamental tailwind despite some concerns about slowing growth.
Microsoft Corporation (MSFT)
Microsoft Corporation, with a substantial market capitalization of $2.77 trillion, trades at a P/E ratio of 23.33, which is more moderate compared to some of its peers. The latest price (~$392.66) remains well below its 52-week high of $555.45. The company exhibits robust profitability, reporting an EPS (TTM) of $13.70, an ROE of 29.65%, and an ROA of 16.45%. It also offers a dividend yield of 0.47%.
From a technical perspective, Microsoft is under a bearish trend, with its price trading below both its 50-day SMA of $406.31 and 200-day SMA of $476.29. The 14-period RSI is in oversold territory at 26.10, indicating potential for a bounce. The composite model score is -28, classifying it as mildly bearish with medium confidence. Key levels are support at $355.04 and resistance at $364.11. A strong bullish divergence on the MACD signals a potential technical bottom. However, several bearish candlestick patterns, including CDLMARUBOZU, CDLEVENINGSTAR, and CDLOUTSIDEBAR, suggest continued selling pressure.
Microsoft is widely recognized as a pivotal player in the AI landscape, with its products being indispensable for infrastructure development. Market sentiment suggests that a significant acquisition in the AI space could further propel its stock, and its resilience has been noted in the context of broader market stability.
Adobe Inc. (ADBE)
Adobe Inc. presents a P/E ratio of 14.01, the lowest among the compared companies, potentially indicating a more attractive valuation for its $98.71 billion market capitalization. The latest price (~$241.21)is significantly off its 52-week high of $422.95. Adobe demonstrates exceptional profitability with an EPS (TTM) of $16.73, the highest in this group, an ROE of 61.34%, and an ROA of 24.17%. Its dividend yield is negligible at 0.01%.
Technically, Adobe is also in a bearish trend, with its price below both its 50-day SMA of $267.92 and 200-day SMA of $330.16. The 14-period RSI is deeply oversold at 24.97. The composite model score is -13, indicating a mildly bearish signal with low confidence. Support is identified at $232.07 and resistance at $238.70. Multiple bullish divergences on both MACD and RSI suggest a strong potential for a rebound. A bullish CDLENGULFING pattern was detected, juxtaposed with bearish CDLSHOOTINGSTAR and CDLEVENINGSTAR patterns, presenting a complex technical outlook.
No specific fundamental catalyst was identified for Adobe's recent movements; the price action appears predominantly technically driven.
Workday, Inc. (WDAY)
Workday, Inc. trades at a relatively high P/E ratio of 50.17, with a market capitalization of $34.18 billion. The latest price (~$119.47) is considerably lower than its 52-week high of $276.00. The company's EPS (TTM) stands at $2.61, while its profitability metrics, with an ROE of 8.88% and an ROA of 3.83%, are lower compared to ServiceNow, Microsoft, and Adobe.
Workday is experiencing a bearish trend, with its price below its 50-day SMA of $150.10 and 200-day SMA of $208.87. The 14-period RSI is neutral at 32.14. The composite model score is -18, indicating a mildly bearish signal with medium confidence. Key levels include support at $121.86 and resistance at $126.94. A strong bullish divergence on the RSI suggests a possible turning point. However, bearish CDLSHOOTINGSTAR patterns were observed, alongside a bullish CDLMORNINGSTAR pattern, indicating conflicting signals.
For Workday, no specific fundamental catalyst was identified; the recent price movement appears to be primarily technically driven.
Atlassian Corporation (TEAM)
Atlassian Corporation, with a market capitalization of $17.95 billion, is the smallest company in this comparison. A P/E ratio was not available for the company. The latest price (~$61.79) represents a substantial drop from its 52-week high of $242.00. The company reported negative profitability with an ROE of -19.08% and an ROA of -4.25%, and EPS (TTM) was also not available.
Technically, Atlassian is in a bearish trend, trading well below its 50-day SMA of $88.49 and 200-day SMA of $149.05. The 14-period RSI is neutral at 36.20. The composite model score is -19, indicating a mildly bearish signal with medium confidence. Key levels include support at $65.19 and resistance at $68.63. While strong bullish divergences on MACD and moderate bullish divergences on RSI suggest potential for recovery, a moderate bearish divergence on RSI adds complexity. A bullish CDLHARAMI pattern was noted, yet the technical picture remains mixed.
No specific fundamental catalyst was identified for Atlassian's movements, suggesting the price action is largely technically driven.
Comparative Insights
Valuation and Profitability Overview
Among the five software giants, Adobe Inc. (ADBE) stands out with the lowest P/E ratio at 14.01 and superior profitability, boasting the highest EPS (TTM) at $16.73, an ROE of 61.34%, and an ROA of 24.17%. Microsoft Corporation (MSFT) presents a more moderate P/E of 23.33 with strong profitability (ROE 29.65%, ROA 16.45%) and the largest market capitalization at $2.77 trillion. ServiceNow, Inc. (NOW) and Workday, Inc. (WDAY) trade at higher P/E ratios of 66.04 and 50.17, respectively, reflecting growth expectations, with market caps of $117.07 billion and $34.18 billion. Atlassian Corporation (TEAM), the smallest by market cap at $17.95 billion, lacks a reported P/E ratio and shows negative profitability, with an ROE of -19.08% and an ROA of -4.25%. Microsoft and Adobe offer negligible dividend yields (0.47% and 0.01% respectively), while the others do not currently offer dividends.
Technical Signals and Key Levels
All five companies are currently experiencing bearish trends, with their prices trading below both their 50-day and 200-day Simple Moving Averages, and all carry a 'mildly bearish' overall signal. Microsoft and Adobe appear most oversold, with RSI (14) readings of 26.10 and 24.97, respectively, indicating a higher potential for tactical bounce-backs. Both also exhibit strong bullish divergences—MACD for Microsoft, and multiple MACD and RSI divergences for Adobe—suggesting an impending shift in momentum. ServiceNow and Workday have RSI readings closer to neutral at 32.13 and 32.14, respectively, implying they are not as deeply oversold, though both display bullish RSI divergences. Atlassian's RSI of 36.20 is also in neutral territory, but its technical picture is complicated by both bullish (MACD, RSI) and moderate bearish (RSI) divergences. Support levels range from Atlassian's $65.19 to Microsoft's $355.04, while resistance levels are from Atlassian's $68.63 to Microsoft's $364.11. The signal confidence varies, with Adobe's mildly bearish signal having low confidence (-13), while others like Microsoft (-28), ServiceNow (-21), Workday (-18), and Atlassian (-19) have medium confidence.
Key Differentiators
Despite a sector-wide 'mildly bearish' sentiment, distinct characteristics emerge. Microsoft and Adobe, with their deeply oversold RSI readings and strong bullish divergences, present potential opportunities for tactical investors looking for reversals. Adobe's significantly lower P/E ratio (14.01) makes its valuation particularly compelling, especially given its strong profitability. Microsoft’s strong trend, indicated by an ADX of 32.4, reinforces the strength of its current bearish move despite its oversold condition. ServiceNow and Workday, while also showing bullish RSI divergences, are not as oversold, and their higher P/E ratios (66.04 for ServiceNow, 50.17 for Workday) highlight investor premium for growth. Atlassian, characterized by a lack of P/E data and negative profitability, along with conflicting technical divergences, stands as a higher-risk proposition, further underscored by a deep drawdown from its 52-week high (upstream return fields for this name failed plausibility checks, so avoid quoting a single headline percentage). It is noteworthy that for Adobe, Workday, and Atlassian, the absence of identified fundamental catalysts suggests their recent price movements are primarily technically driven.
Investor Considerations
Investment preferences among these software giants depend significantly on an investor's risk appetite, investment horizon, and specific market convictions.
Microsoft Corporation may appeal to investors seeking exposure to a diversified market leader with robust fundamentals and significant involvement in AI infrastructure. Its current oversold technical conditions, with an RSI (14) of 26.10, combined with a strong bullish MACD divergence, could present a tactical entry point for those who believe the established bearish trend is nearing exhaustion. The medium confidence in its mildly bearish signal suggests a somewhat predictable downtrend, which might offer opportunities for nimble traders.
Adobe Inc. could be compelling for value-oriented investors prioritizing strong profitability and a comparatively low P/E ratio of 14.01, despite its current technical weakness. The multiple bullish divergences on MACD and RSI, along with a deeply oversold RSI (14) of 24.97, suggest significant technical potential for a rebound. However, the low confidence in its mildly bearish signal implies greater short-term uncertainty, making it suitable for those comfortable with higher volatility in pursuit of longer-term value.
ServiceNow, Inc. & Workday, Inc. might attract growth investors willing to pay a premium P/E (66.04 and 50.17, respectively) for companies with strong enterprise software models. The bullish RSI divergences in both offer hope for a turnaround, positioning them as potential buys if broader market sentiment improves or specific sector catalysts emerge. Their RSI readings, closer to neutral (32.13 and 32.14), indicate they are not as deeply oversold as Microsoft or Adobe.
Atlassian Corporation is suited for investors with a higher risk tolerance, potentially looking for a turnaround play after a dramatic slide from its 52-week high, coupled with identified bullish divergences. However, the company's negative profitability, absence of clear fundamental catalysts, and conflicting bullish and bearish RSI divergences introduce higher uncertainty and risk. This profile might appeal to those seeking outsized returns from a potential rebound, provided they understand the elevated risk profile.
Caveats and Disclaimer
This analysis is based on historical data and technical indicators, which are not guarantees of future performance. Market conditions can change rapidly, and past performance does not guarantee future results. This content is for educational and informational purposes only and does not constitute financial advice. Investors should conduct their own due diligence and consult with a qualified financial advisor before making any investment decisions.
Data Sources: Market data (prices, quotes, and fundamental figures) used elsewhere in the pipeline are sourced from EOD Historical Data (EODHD). Technical indicators and derived signals (including RSI, MACD, ADX, pivots, and composite scores) are calculated by Clear Signals and are not supplied by EODHD.